Package Usage
Installation
The package is published on PyPI.
$ pip install mvbep
Requirements
holidays>=0.14.2
joblib>=1.1.0
numpy>=1.20.3
pandas>=1.3.4
plotly>=5.7.0
schema==0.7.5
scikit_learn>=1.0.2
shap>=0.41.0
statsmodels>=0.12.2
xgboost>=1.6.0
MVBEP
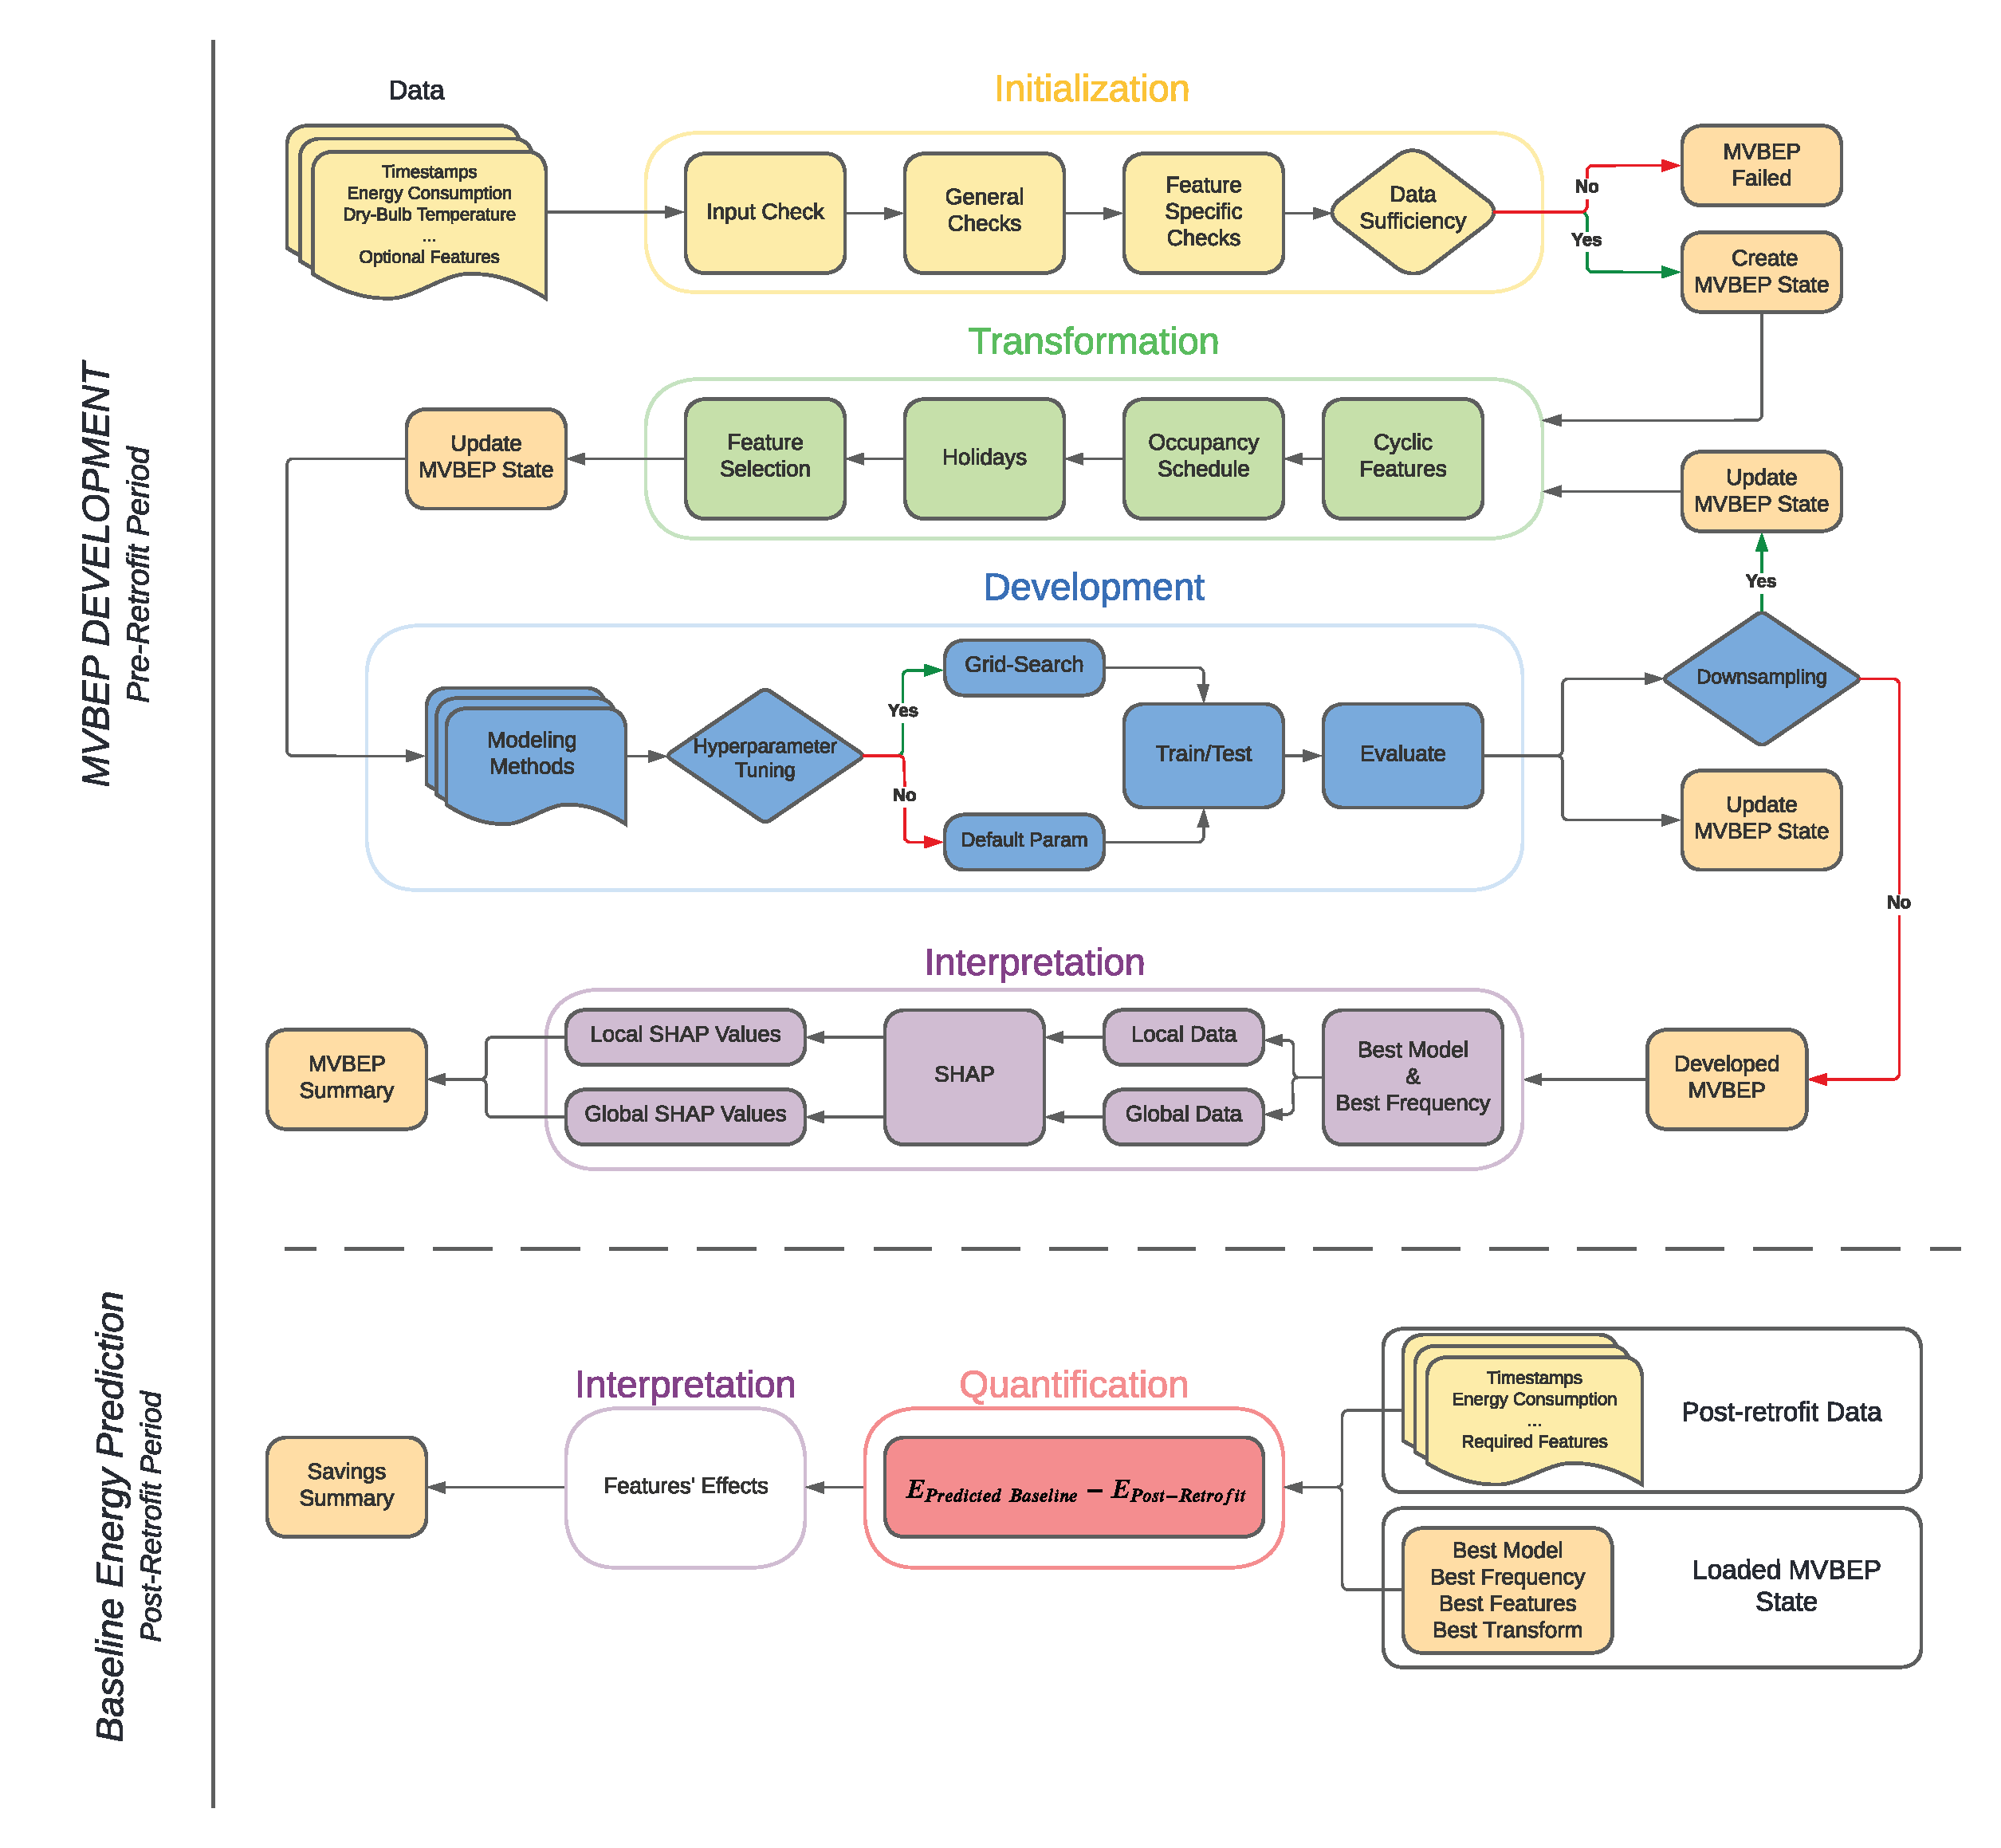
Measurement and Verification Building Energy Prediction (MVBEP) is an open-source framework for developing data-driven models for predicting the building baseline energy consumption and estimating savings associated with retrofitting in the post-retrofit period. The package relies on three main steps to quantify the achieved savings in the post-retrofit period:
Initialization
Development
Quantification
Each step is described with examples below
Initialization
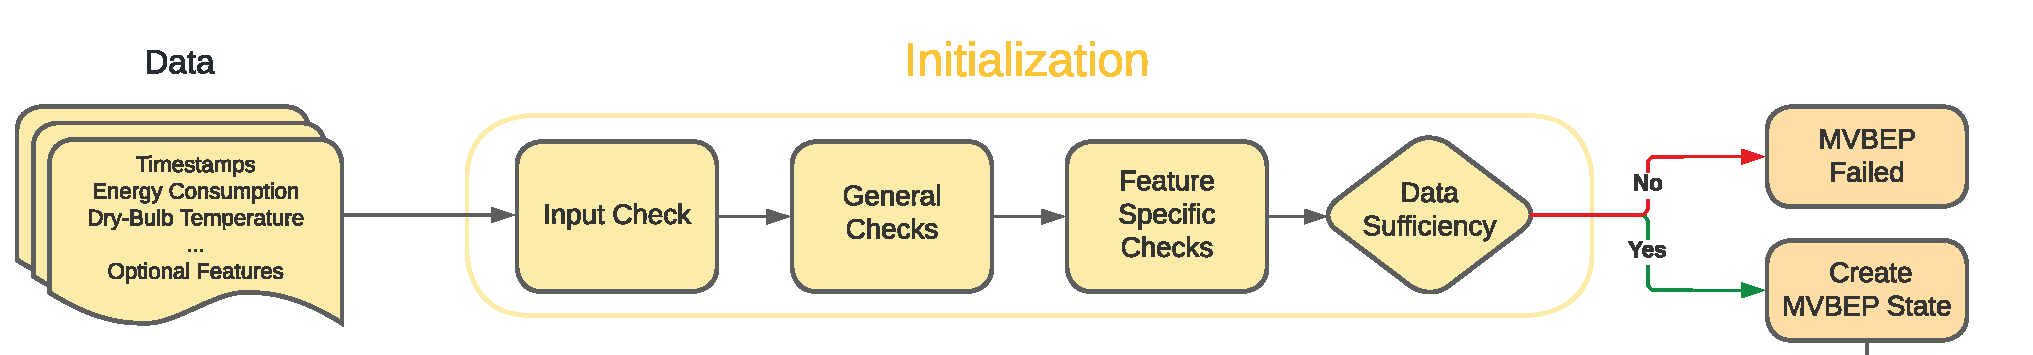
The initialization process aims to determine if the input data is sufficient to build a baseline. This is enforced by using thresholds that can be edited by the user.
Initialization Data Sufficiency Checks
1. Input Check
Minimum Features: The supplied
pd.DataFramemust have at least features: timestamps, energy consumption, and outdoor dry-bulb temperature.Possible Frequency: The timestamps frequency or intervals of recorded values should be either 15-min or hourly. The package does not support yet daily frequency.
2. General Checks
Minimum Time Range: The data must include at least a range of 365 days. This threshold can be modified by the user by passing a different value for
n_dayswhen usingfit_training().Maximum Number of Missing Values: This threshold is dependent of the input data frequency. The threshold represents 10% of the possible values count in a year.
If
15-min, the threshold is 3,500 values.If
hourly, the threshold is 876 values.
Maximum Number of Consecutive Missing Values This threshold aims to limit the effect of many consecutive missing values which is difficult to replace. Based on the frequency, the threshold is set to represent a full repeating important cycle (i.e. one day for both
15-minandhourly.If
15-min, the threshold is 96 values.If
hourly, the threshold is 24 values.
3. Feature-Specific Checks
Timestamps Format Mismatch Fraction: The MVBEP model will fail if more than 30% of the timestamps are not consistent. In addition, jumps in timestamps are interpreted as missing values. If the input data span more than a year and the first year contains many missing values, it is recommended that the data is cropped to include the continuous part that does not have many missing values.
Energy Consumption Negative and zero values are interpreted as missing values. The missing values for all features are replaced by using
pandas.Series.interpolate().
Initialization Example
The following example is derived from the example notebook.
>>>   from mvbep.mvbep import MVBEP
>>>   mvbep_obj = MVBEP() # An object of class MVBEP is initialized
>>>   mvbep_obj.fit_training(
...      data                    = df_input,   # Required
...      frequency               = '15-min',   # Required
...      country_code            = None,       # Optional
...      occupancy_schedule      = None,       # Optional
...      mismatch_date_threshold = 0.3,        # Optional
...      total_missing           = None,       # Optional
...      max_consec_missing      = None,       # Optional
...      n_days                  = 360         # Optional
...   )
country_code: The passed value must match the supported country codes as highlighted by holidays library.occupancy_schedule: The passed dictionary must match the shape provided below
>>> annual_list = ['DD-MM' , ..., 'DD-MM']     # Days with generally low occupancy density.
... day_dict = {                               # This represents the general weekly occupancy schedule.
...     '08-10': float,                        # The float represents the general occupancy fraction
...                                            #    (i.e. 1 for the highest occupant density).
...                                            #    Unoccupied hours should not be included).
...     '11-15': float,
...     '16-17': float,
... }
... schedule = {                               # This is the final input that goes inside fit_training().
...     'annually': annual_list,
...     'weekly': {
...         'mon': day_dict,                   # Different days can have different schedules
...         'tue': day_dict,
...         'wed': day_dict,
...         'thu': day_dict,
...         'fri': day_dict,
...         'sat': None,                       # None indicates that the day is generally not occupied.
...         'sun': None
...     }
... }
Initialization Summary Report
This link shows an example of the initialization summary report that is generated after running generate_initialization_summary(). Check Initialization Report for more information.
Development
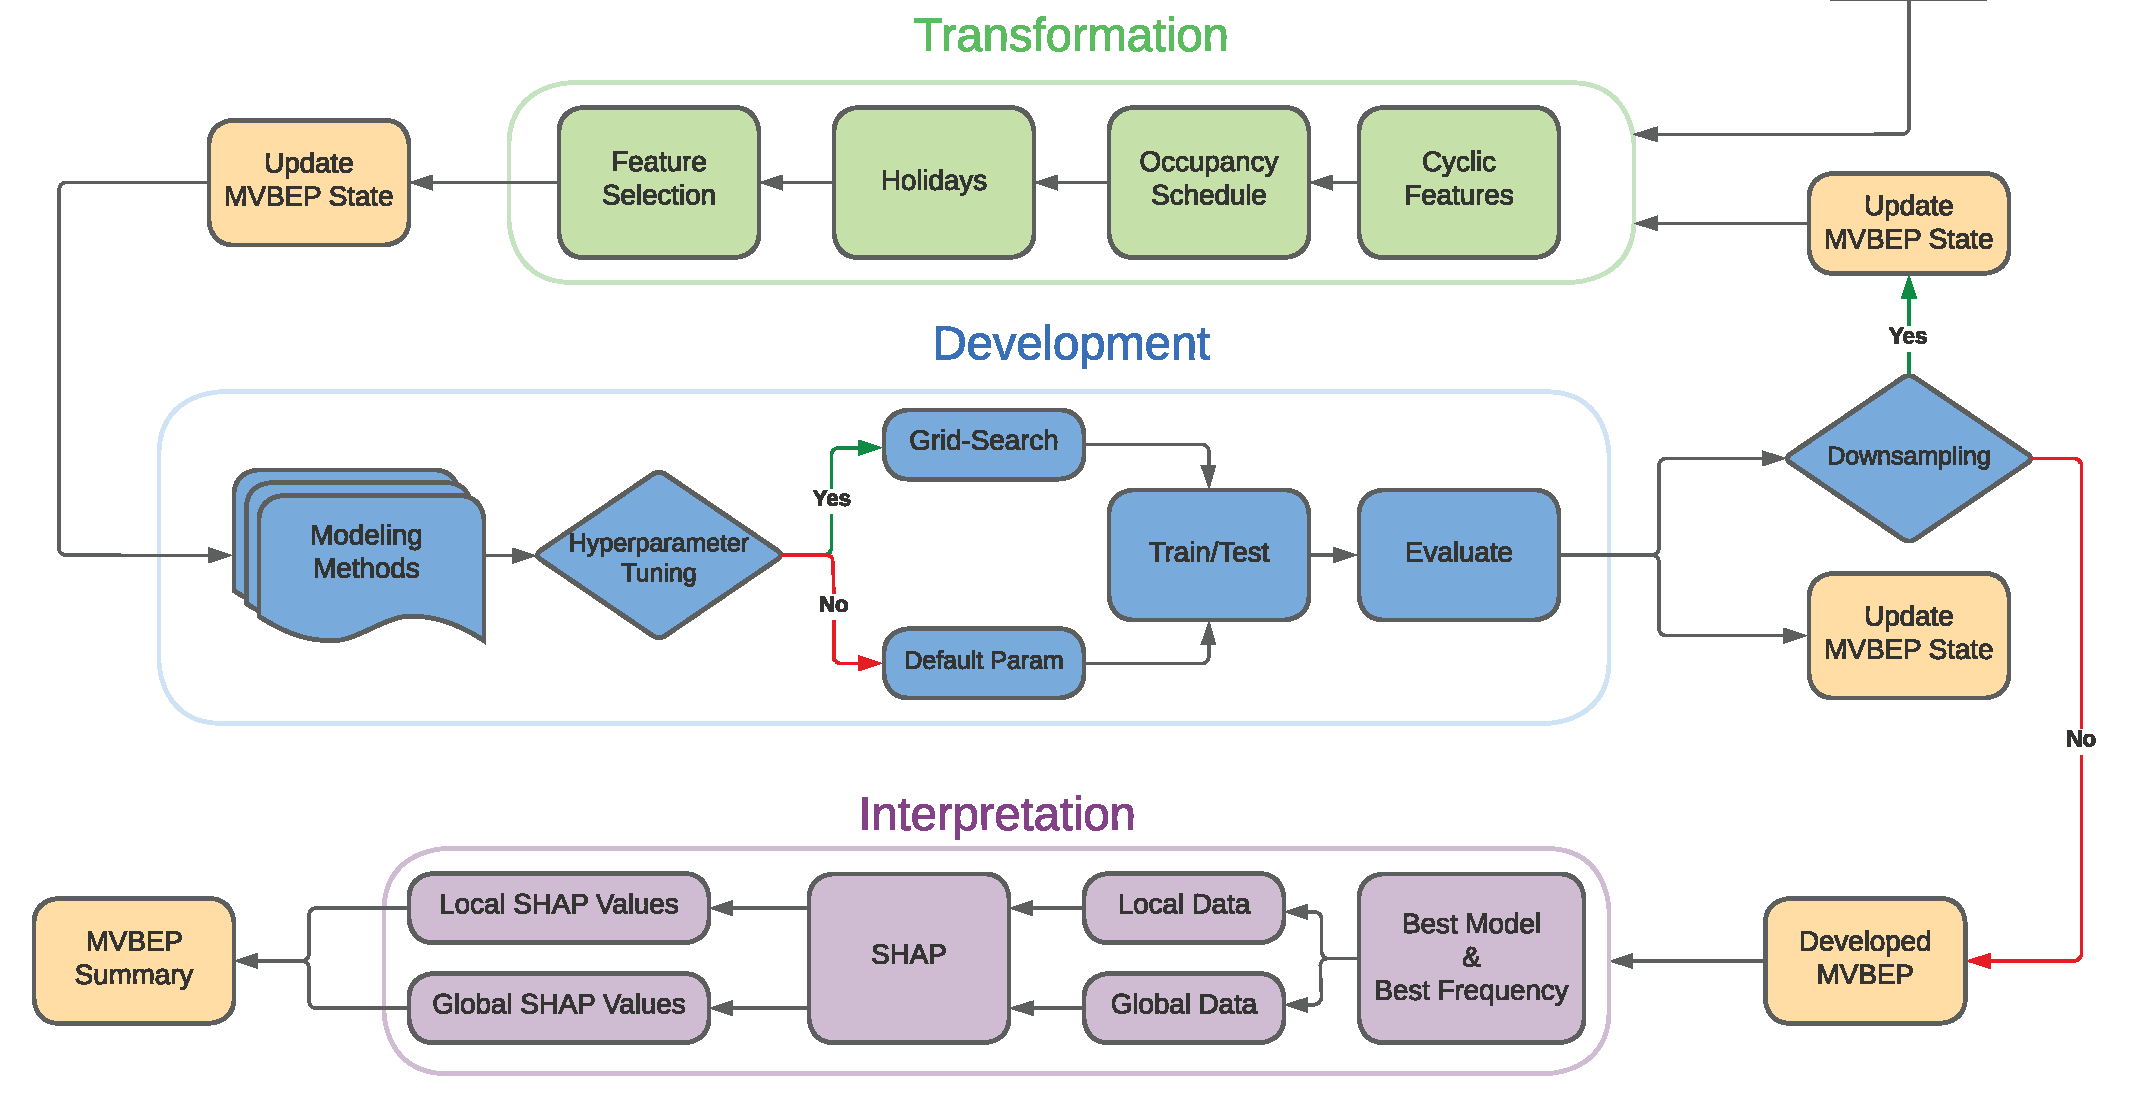
The development process aims to take the checked input data and use it to build a baseline for the M&V analysis.
Development Process
The development process encompasses the following three modules:
Transformation: Processes the verified input data to suitable data tha can be used to train and test the modeling methods.
Development: Trains and evaluates the trained models. If
develop_mvbep()functionhyperparameter_tuningparameter was passed byTrue, hyperparameter tuning is performed for the trained models by using rolling cross-validation.Interpretation: Provides local and global features’ contributions for the testing dataset.
If the function fit_training() was provided with a data that has a 15-min frequency, the development process will downsample the frequency to lower one (e.g. 15-min to hourly). The resulting hourly frequency will also be converted to a daily frequency. In case only hourly input data was used for fit_training(), the resulting downsampling will be only from hourly to daily.
Development Example
After successfully fitting the MVBEP object with input data and checking the initialization report, the MVBEP object starts processing the data and fitting the passed modeling methods in fit_training() function. The following code block shows an example of starting the development phase for mvbep_obj.
>>> mvbep_obj.develop_mvbep(
...        modeling_methods      = None,        # Optional
...        test_size             = 0.2,         # Optional
...        hyperparameter_tuning = False,       # Optional
...        ranking_method        = 'min_cvrmse' # Optional
... )
Development Summary Report
This link shows an example of the development summary report that is generated after running generate_development_summary(). Check Development Report for more information.
Quantification
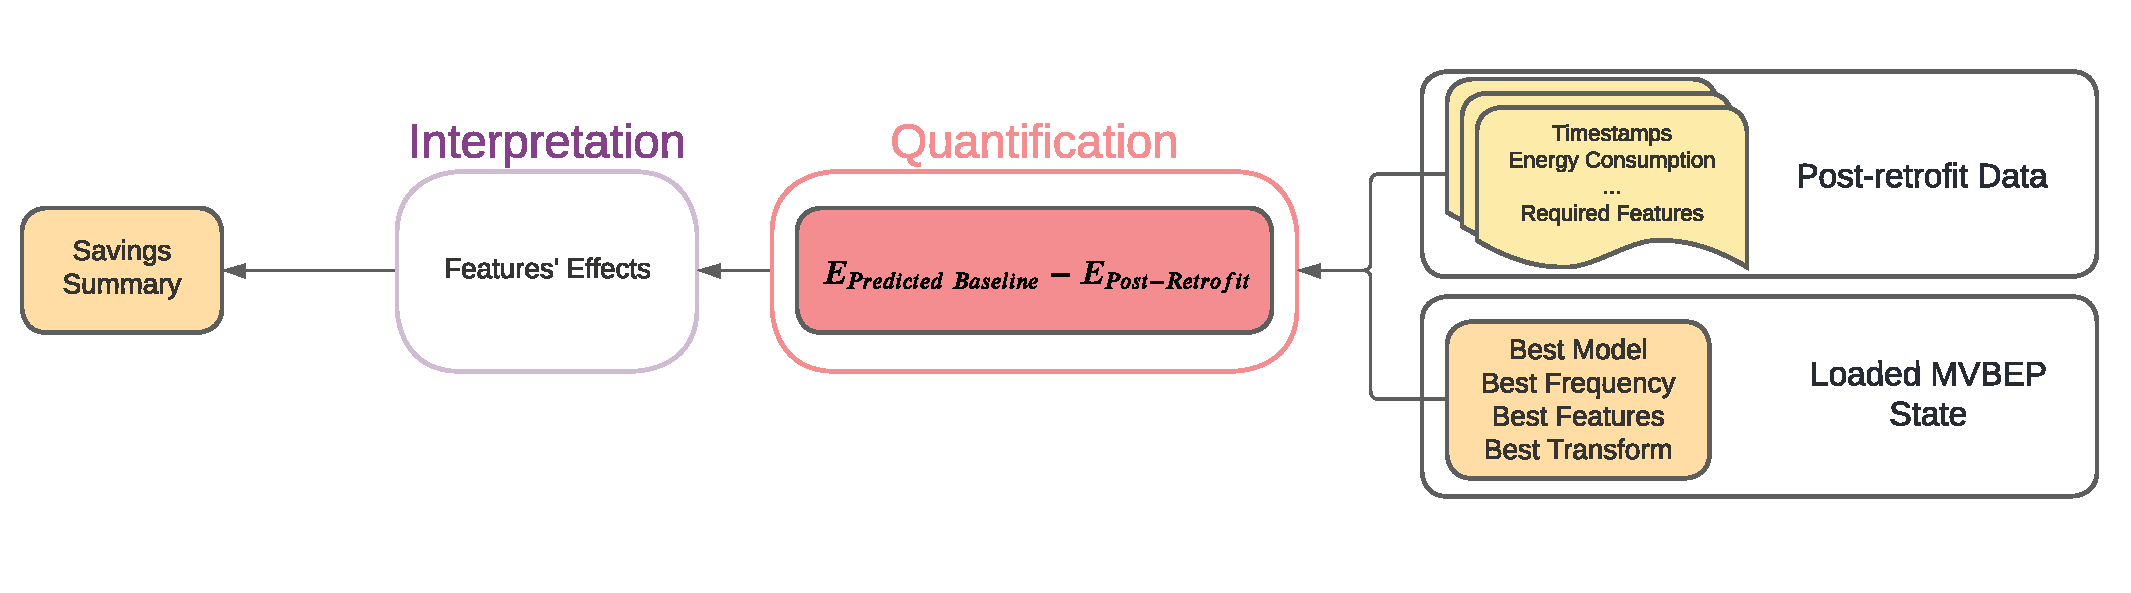
Quantification is the process of using post-retrofit data to quantify the achieved savings or Avoided Energy Use (AEU).
Quantification Process
The process takes the MVBEP object that was developed by using develop_mvbep() and uses the post-retrofit data to make predictions. The sum of predictions minus the sum of recorded energy use in the post-retrofit data represents the AEU. The data is checked first by similar data sufficiency requirements like those mentioned in Initialization Data Sufficiency Checks. The time range threshold is not used but two thresholds are added: post-retrofit min date and minimum features. The former aims to avoid having timestamps that are observed in the pre-retrofit (i.e. input data for fit_training()) while the latter aims to highlight any missing features that was used in the transformation process.
Quantification Example
After successfully developing the mvbep_obj data by using develop_mvbep() any valid post-retrofit data can be used to calculate the AEU. The code block below shows an example of using the same mvbep_obj in the previous examples
>>> mvbep_obj.predict_energy_consumption(
...             data                    = post_retrofit,     # Required
...             generate_summary        = False,             # Optional
...             file_name               = None,              # Optional
...             mismatch_date_threshold = 0.3,               # Optional
...             total_missing           = None,              # Optional
...             max_consec_missing      = None               # Optional
... )
Quantification Summary Report
This link shows an example of the quantification summary report that is generated after running predict_energy_consumption(). Check Quantification Report for more information.